In my undergrad studies, I never worked with designing or working with discrete MOSFET circuits.
When it came to CMOS, it was always simulation based study. As a result, it never gave the physical feel of MOSFETS.
In my quest to satiate my anxiety to design with discrete mosfets, a few years ago, I came across following course material from the Worcester Polytechnic, MA : ECE4902 - Analog IC Design - Joh McNeil.
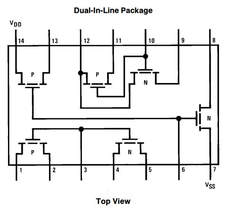
What was different in this course was that, it was accompanied with labs, wherein a CMOS op-amp is designed/analysed using discrete components. Well not exactly discrete MOSFETS, but rather using a MOSFET array chip - CD4007, which is also called as hex inverter. It consists of 3 pmos-nmos pairs within a DIP package and thus usable on breadboard.
In excitement, I went ahead and ordered a couple of CD4007 IC's, from a little know website "onlinetps".
When it came to CMOS, it was always simulation based study. As a result, it never gave the physical feel of MOSFETS.
In my quest to satiate my anxiety to design with discrete mosfets, a few years ago, I came across following course material from the Worcester Polytechnic, MA : ECE4902 - Analog IC Design - Joh McNeil.
What was different in this course was that, it was accompanied with labs, wherein a CMOS op-amp is designed/analysed using discrete components. Well not exactly discrete MOSFETS, but rather using a MOSFET array chip - CD4007, which is also called as hex inverter. It consists of 3 pmos-nmos pairs within a DIP package and thus usable on breadboard.
In excitement, I went ahead and ordered a couple of CD4007 IC's, from a little know website "onlinetps".
As a reference, the expeyes-junior itself had an example for bjt CE-characteristics setup for Ic vs Vce vs ib setup.
The setup in itself is quite ingenous, wherein we need to accomplish it using the poor man's scope.
Below is a snapshot from the expeyes manual:
The setup in itself is quite ingenous, wherein we need to accomplish it using the poor man's scope.
Below is a snapshot from the expeyes manual:
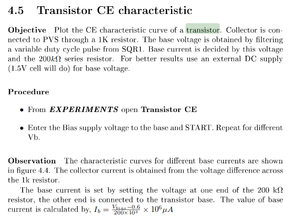 | 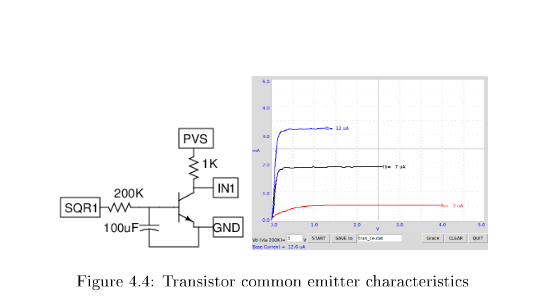 |
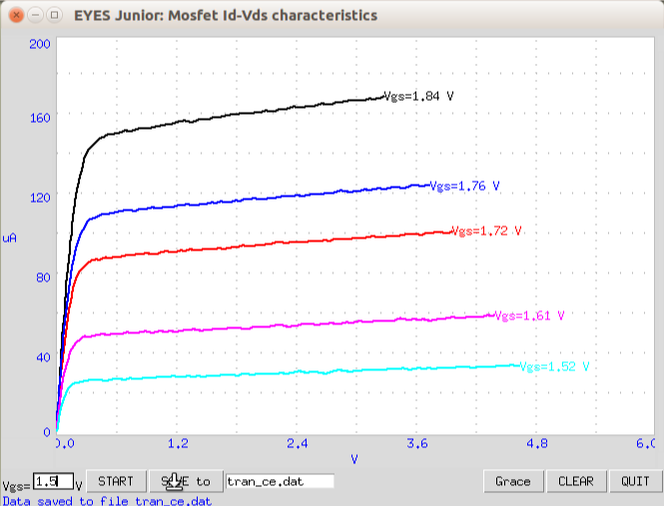
I setup almost similarly , with B,C,E going as replacements for G(pin6),D(pin8),S(pin7) of the N-MOS in the CD4007 chip and using 10K instead of 1K. We need to sweep two voltage sources, primarily VDS and VGS. Rather, we first fix VGS to a particular value and then sweep the VDS , which measuring the ID.Thus we get different set of curves for each VGS.
But on expeyes we have only one programmable source (PVS). For the other source, the manual suggests the use of RC filtered PWM(SQR1) to generate the required voltage.
After preliminary fixing of the transistor_ce.py script in package, I gave a first run and the plots looked wierd. What I noticed is that the filtered PWM was niether settling to the voltage programmed via the api and also it took some time for the filtered output to settle to the actual value. To settling issue comes because of the open loop nature of the filtering. To fix it , I tapped in the filtered output and wrote some controller code to measure the difference from expected value and increase the PWM duty cycle accordingly, unless the output settles within 2% tolerance of the programmed value. After some more tweaking and iterations for different VGS values, below is the beautiful curve I got:
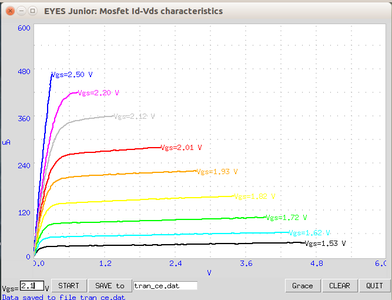 |  |
Now that we have the data, the next steps in the lab is to do curve fitting and estimate the value of the rds and ron.
The following lab supplement gives details on how to do it and also provides sample matlab(octave compatible) code to assist in curve fitting. In the course labs, they use a sophisticated scope with specific data formatting, so some effort was needed to tweak the code to work for our expeyes saved data.
The following lab supplement gives details on how to do it and also provides sample matlab(octave compatible) code to assist in curve fitting. In the course labs, they use a sophisticated scope with specific data formatting, so some effort was needed to tweak the code to work for our expeyes saved data.
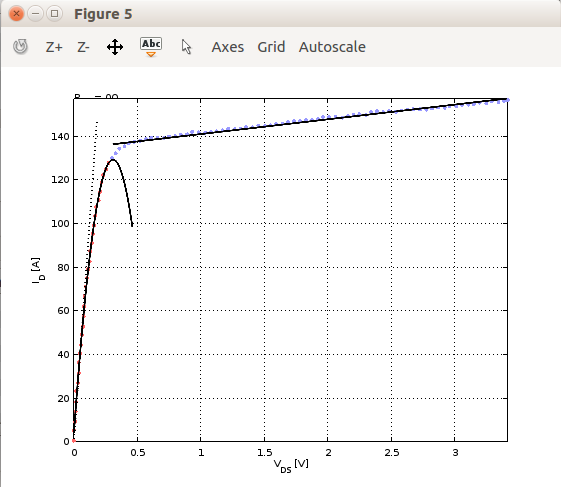 Some issue with octave on my computer. The annotated text does not display if axes are on. | 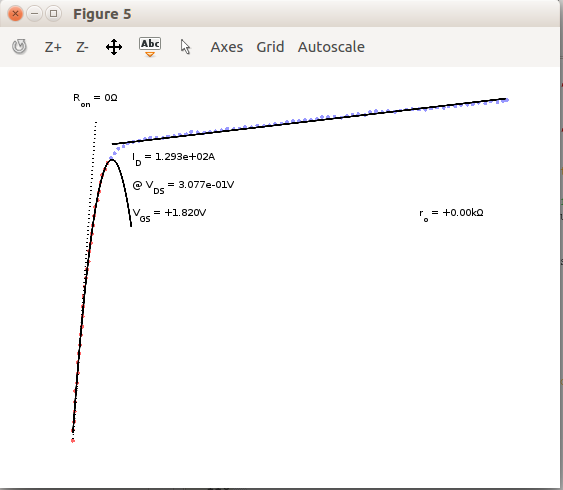 Curve fit values annotated to graph. |
Code for both MOS characterisation experiment as well as modified curve fitting code is available on my github page here:
https://github.com/shabbarvejlani/expeyes_experiments
 RSS Feed
